This template gives you a current snapshot by showing a total count of subscriptions that meet certain criteria, a sum, an average, a min, or a max. Or in other words, a subscription counter.
Setting Up the Subscription Counter Report
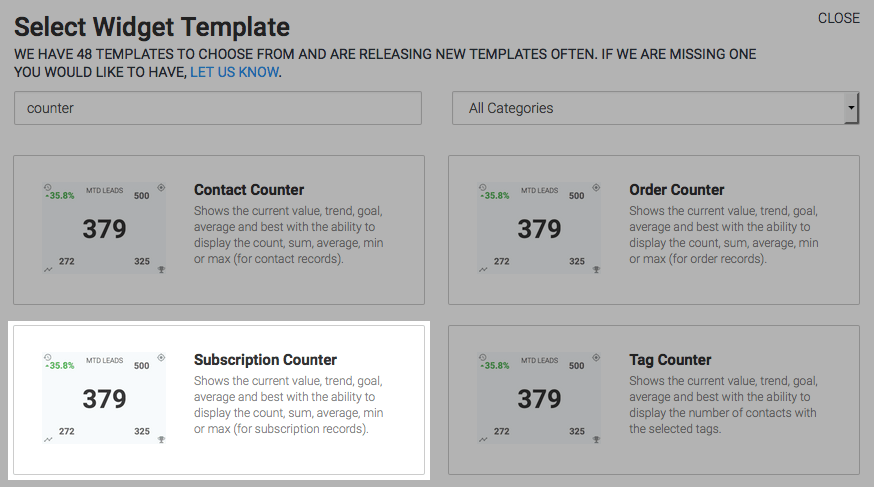
To begin, click the “+” icon on the Dashboard and type “counter” into the search bar. Then select the “Subscription Counter” template.
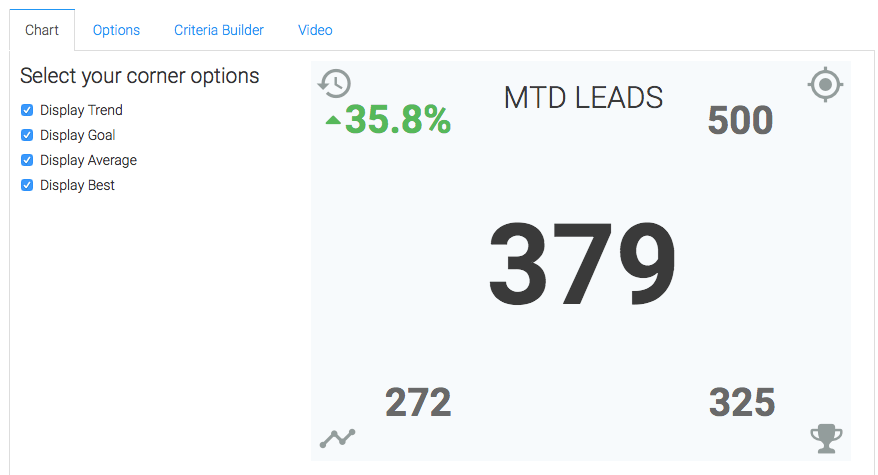
Clicking on each box will make each statistic appear on the chart. In the top-left corner will be Trend, in the top-right will be Goal, bottom-left will have the Average which takes into account the last six cycles, and lastly in the bottom-right will be the Best which will account for the last six cycles. Your cycles are determined by the settings you choose in the Options Tab.
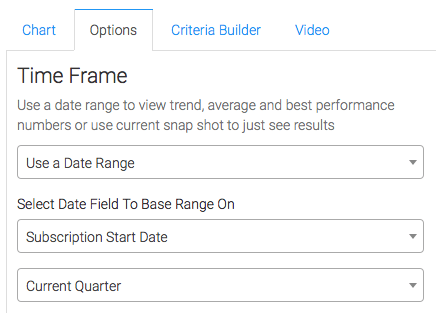
Navigate to the “Options” Tab and select your time frame. If you choose “Just see current results” you will lose the ability to have the Trend, Average, and Best Performance display.
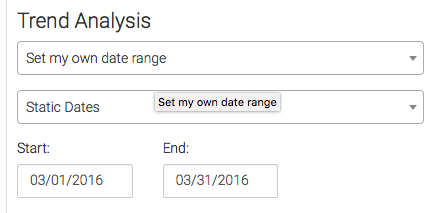
Next choose the settings for your trend analysis.
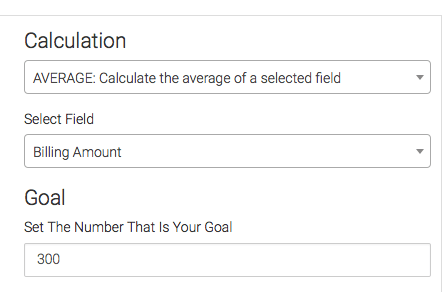
Then choose your calculation settings and your goal.
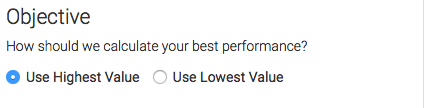
Now choose your objective.
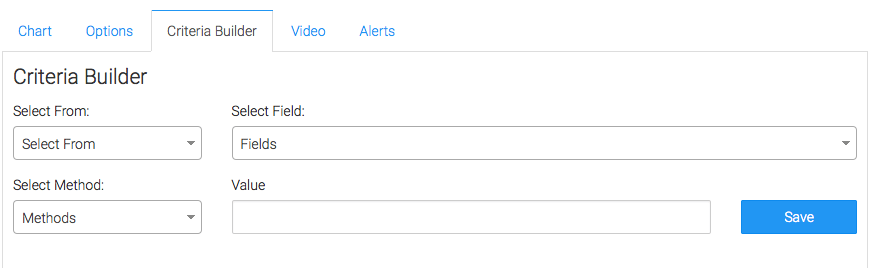
For ultimate control and customization, use the “Criteria Builder” to include additional rules and requirements to the report. This way you can filter your data by any field on the contact record.
Once you have your everything set, click “Save Preferences” on This Widget.
Relevant Articles
- How to Configure the Subscription Stick Rate Report
- How to Set Up the Subscription Cancellations Report
Create Your Free Graphly Dashboard
You don’t need to struggle to find the data you need from your Infusionsoft or Keap application. Create a free visual dashboard using the Graphly Lite plan. Using Graphly Lite, you get 1 user, 2 dashboards, and access to our 10 most widely used report templates. These templates include:
- Tags Applied
- Tags Applied Goal
- Leads
- Gross Revenue
- Appt | Note | Task Summary
- Email List Health
- Refunds
- Campaign Email Stats
- Text Widget Area
If you don’t already have a Graphly account, click here to get a Graphly Lite account so you can start making more informed decisions and grow your business.