The Transactional Lifetime Value template allows you to see the lifetime value from the very first transaction as well as the lifetime value at eleven other subsequent transactions of your choosing.
Search for the Transactional Lifetime Value Template
To begin, click the “+” icon on the Dashboard and type lifetime into the search bar. Then select the “Transactional Lifetime Value” template.
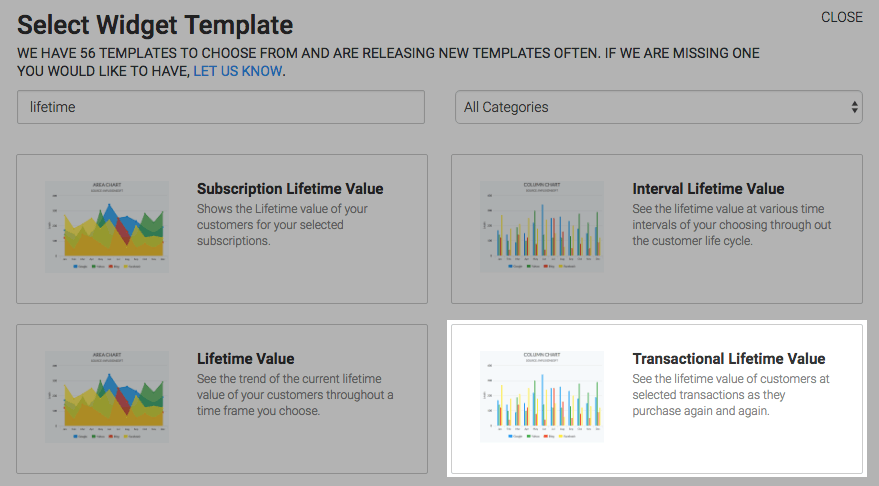
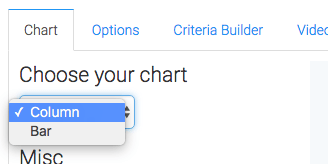
Chart Tab
There are two options for the chart type, column and bar. I’ll use column.
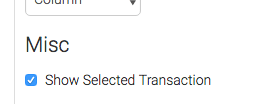
By clicking the Show Selected Transaction check box, the dollar amount for the transaction you select will be displayed in the top-right corner of the chart.
Options Tab
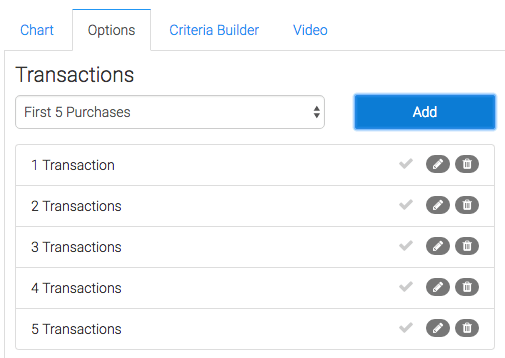
Now navigate to the Options tab and select your transactions. We’ve included some common presets here to help speed up this process.
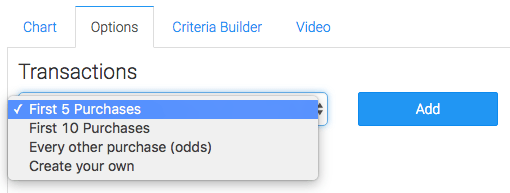
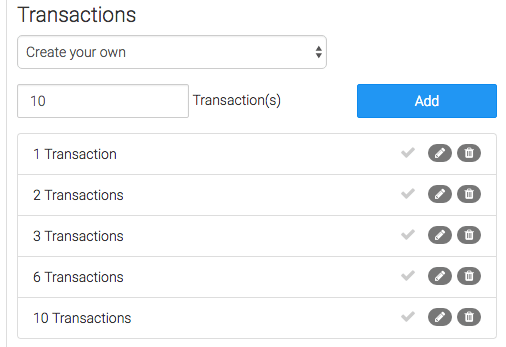
You can also create your own transactions from scratch. The maximum number of transactions is currently twelve. If you need more, you can copy the widget to create more.
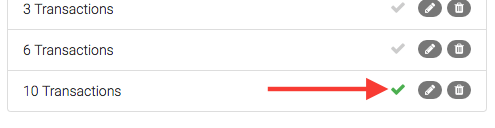
Once your transactions are set up you can check any one of them to have it displayed in the top-right hand corner of the chart.
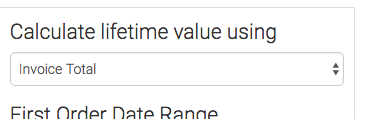
Next choose the value you want Graphly to use to calculate the lifetime value.
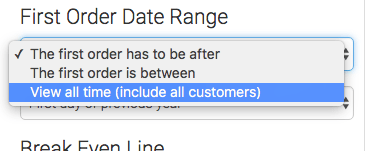
Then choose your First Order Date Range. Without this option we’d only be able to measure all transactions since the creation of your Keap application. In other words, all time. There is an option for this which is View all time.
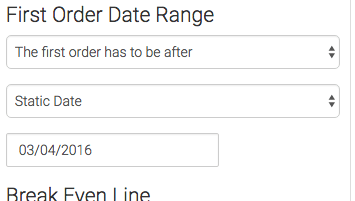
The most common option is to select a date that the first has to be after.
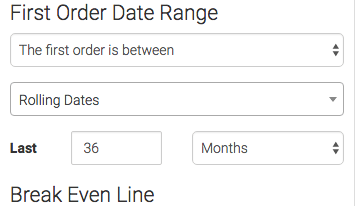
If you want ranges or rolling dates, choose The first order is between option.
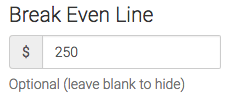
The Break Even Line setting is completely optional, but if set will display a line on your chart.
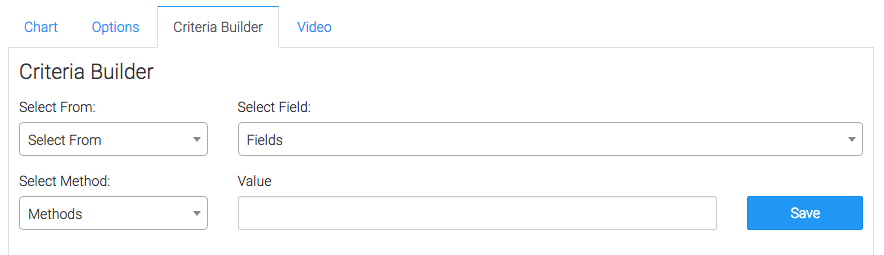
Criteria Builder Tab
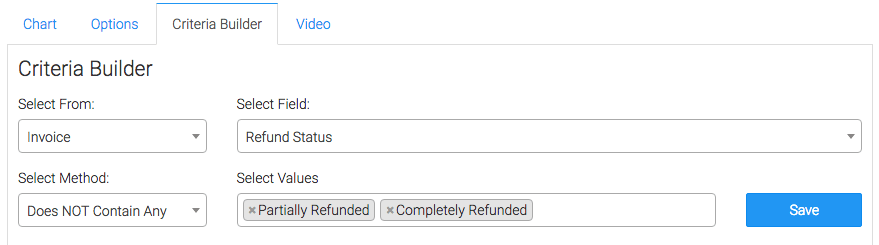
For ultimate control and customization, use the Criteria Builder to include additional rules and requirements to the report.
The most common example for this particular report is to select from the invoice where the refund status doesn’t contain partially refunded or completely refunded.
Once you have your everything set, click Save Preferences on this Widget.
Relevant Articles
- How to Set Up the Lifetime Value Report
- How to Set Up the Subscription Lifetime Value Report
- How to Set Up the Interval Lifetime Value Report
Try Graphly for Just $1!
Unlock the full potential of your data with Graphly! Sign up for our 14-day trial for only $1 and gain access to a wide range of powerful reports designed to help you make data-driven decisions. Here are some of the reports you can explore:
- Opportunity Leaderboard: Track and analyze your team’s performance.
- Gross Revenue: See the money coming into your Keap account over time.
- Opportunity Forecast: Forecast the adjusted revenue of active opportunities based on the stage probability.
- Units Sold: See the number of units sold for each product you select over a given date range.
- Campaign Email Stats: Measure the impact and conversion of your marketing campaigns.
- Tags Applied: See how many tags get applied to contacts during a period of time.
Don’t miss out on this limited-time offer! Start Your 14-Day $1 Trial Now.