This template gives you clarity into how much value per lead is created x number of days after a tag has been applied to the contact record.
Setting Up the Value Per Lead by Tag Report
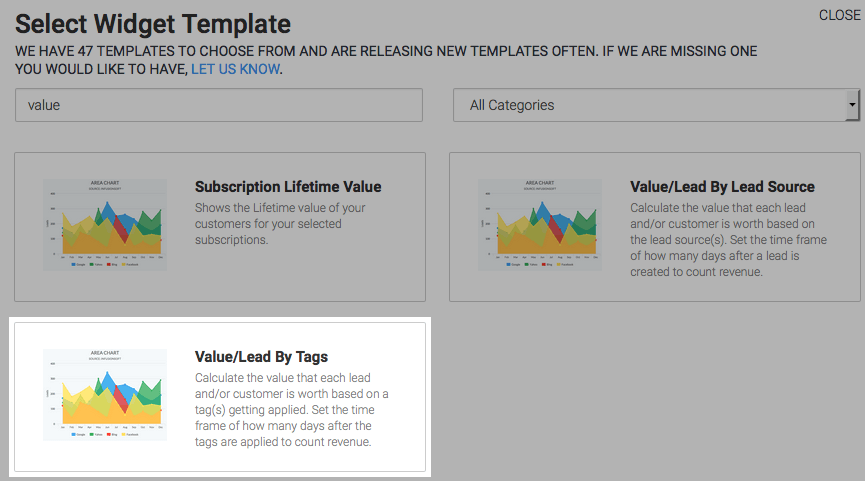
To begin, click the “+” icon on the Dashboard and type “value” into the search bar. Then select the “Value/Lead By Tags” template.
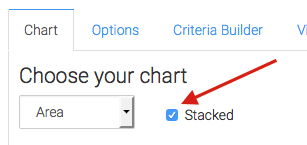
Under the Chart tab, you’ll see that there are four chart types available. We’ve selected the Area type. You also have the option to stack the data by checking the Stacked box.
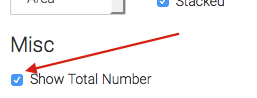
Check the “Show Total Number” box to show the two averages, measured in dollars, in the top right-hand corner of the report.
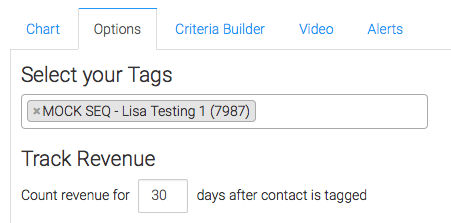
Click on the “Options” Tab and select the tags which you wish to measure, and select how long you would like to track revenue.
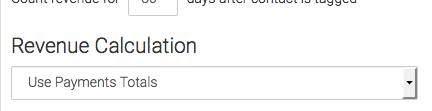
Next, determine how you want to calculate your revenue.
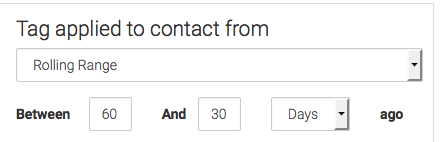
Next, you need to tell Graphly when you want to begin counting data, meaning, when the tag was applied to the data.
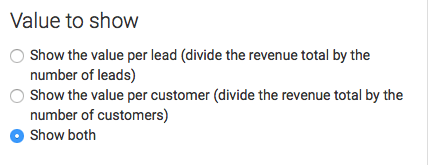
Then select the value to show. There are three options: Show the value per lead, Show the value per customer, or Show both.
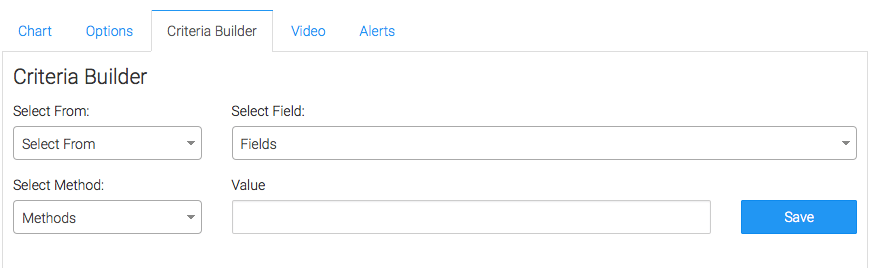
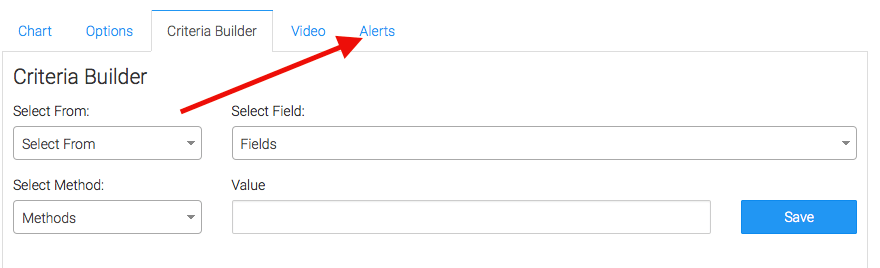
Criteria Builder and Alerts
For ultimate control and customization, use the “Criteria Builder” to include additional rules and requirements to the report. Using this, you can filter your results by any field in the contact record.
Lastly, feel free to set alerts in the Alerts tab for if your values rise above, or fall below a threshold of your choosing.
Once you have your alerts set, click “Save Preferences” on This Widget.
Relevant Articles
Create Your Free Graphly Dashboard
You don’t need to struggle to find the data you need from your Infusionsoft or Keap application. Create a free visual dashboard using the Graphly Lite plan. Using Graphly Lite, you get 1 user, 2 dashboards, and access to our 10 most widely used report templates. These templates include:
- Tags Applied
- Tags Applied Goal
- Leads
- Gross Revenue
- Appt | Note | Task Summary
- Email List Health
- Refunds
- Campaign Email Stats
- Text Widget Area
If you don’t already have a Graphly account, click here to get a Graphly Lite account so you can start making more informed decisions and grow your business.