The Campaign Email Stats template displays the Opens, Clicks, and Conversions for each email in a Campaign Sequence.
IMPORTANT NOTE: Currently this report no longer displays Opened metrics. This is because of a change that email providers have made that doesn’t allow the pixel placed in the email to trigger the Infusionsoft automation link that applies the Opened tag.
Search for the Campaign Email Stats Template
To begin, click the “+” icon on your dashboard and type “Campaign” into the search bar. Then click the “Campaign Email Stats” Widget.
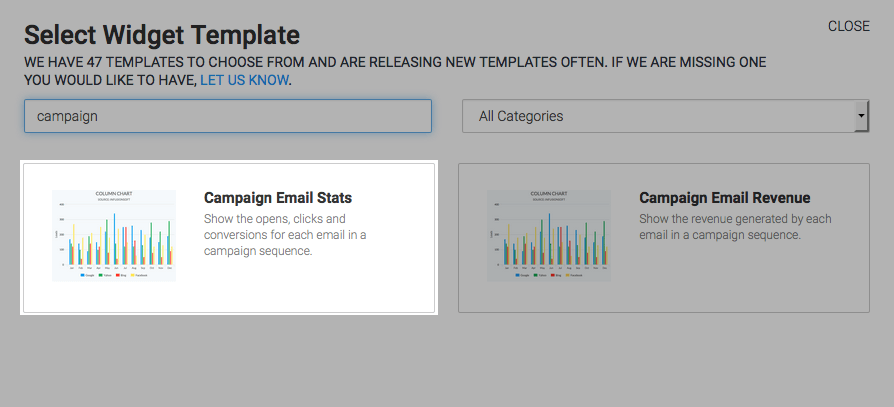
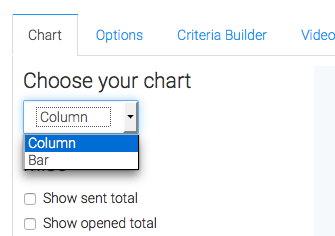
Chart Tab
This report is best viewed as a Column or Bar chart type. I’ll leave mine on Column.
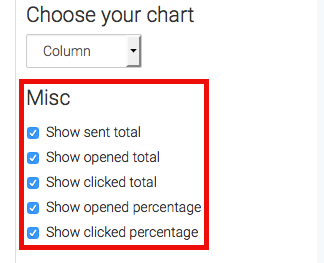
If you click these check boxes, Graphly will total the Sends, Opens, and Clicks of the Individual emails. This is ideal for rolling up numbers in order to measure the entire performance of an entire sequence. So you may want to name the widget the same name as the sequence in your campaign.
Options Tab
Now click over to the Options tab. This is where you will add all of the emails you wish to track. You can limit the emails you include to one sequence per widget, or perhaps your campaign is relatively small and you want to add every email in the campaign. Both approaches work, but I personally like to limit it to the sequence and then layout multiple widgets representing all of my sequences in the campaign side by side on a campaign-specific dashboard.
First, you’ll give your email a name. This will likely match the name of your email in Infusionsoft, but it doesn’t have to. It will serve as a label for that data in the report.
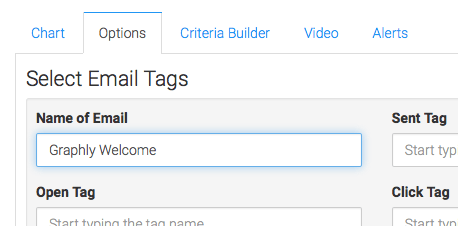
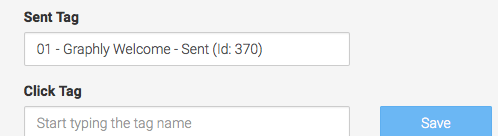
Next, choose your sent tag.
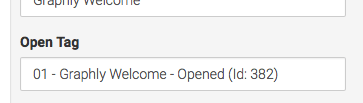
Then do the same thing for your Open tag.
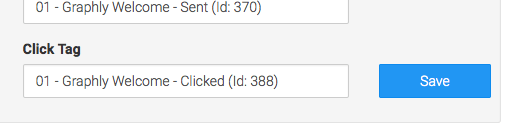
And finally your click tag. Now click build.
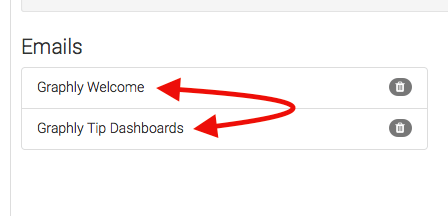
Then for your next email you’ll go through the process of Labeling, selecting your tags, and then clicking the build button again. Repeat this process until you have included all of your emails.
If at any point you need to rearrange the order that the emails are displayed, you can drag and drop them into the desired order.
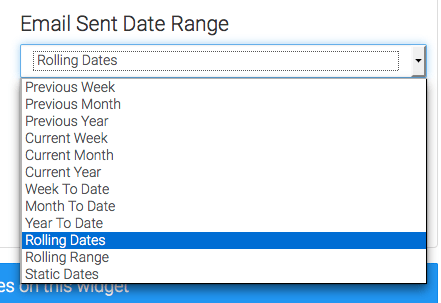
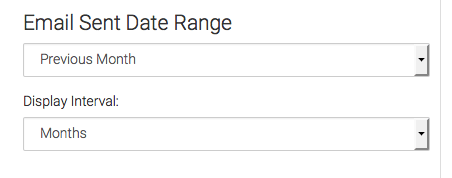
Next, select the date range you wish to measure based on when the email was sent. You can choose to just display the month as a whole versus breaking it down into days or weeks.
Criteria Builder Tab
For ultimate control and customization, continue using the Criteria Builder to include additional rules and requirements to the report.
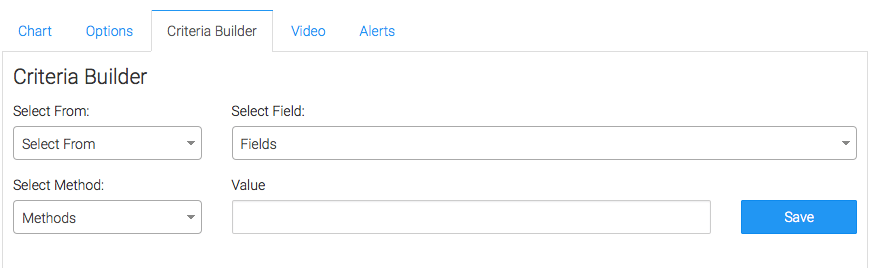
Once you have your criteria set, click Save Preferences on This Widget.
Relevant Articles
- Setting Up Email Reporting in Infusionsoft’s Campaign Builder
- How to Configure the Daily & Hourly Email Engagement Report
- How to Set Up the Campaign Email Revenue Report
Create Your Free Graphly Dashboard
You don’t need to struggle to find the data you need from your Infusionsoft or Keap application. Create a free visual dashboard using the Graphly Lite plan. Using Graphly Lite, you get 1 user, 2 dashboards, and access to our 10 most widely used report templates. These templates include:
- Tags Applied
- Tags Applied Goal
- Leads
- Gross Revenue
- Appt | Note | Task Summary
- Email List Health
- Refunds
- Campaign Email Stats
- Text Widget Area
If you don’t already have a Graphly account, click here to get a Graphly Lite account so you can start making more informed decisions and grow your business.