The contact counter template gives you a current snapshot by either showing a total count of contacts that meet certain criteria, a sum, an average, a min, or a max. Graphly will also compare your current performance to a previous cycle or range.
Setting Up the Contact Counter Report
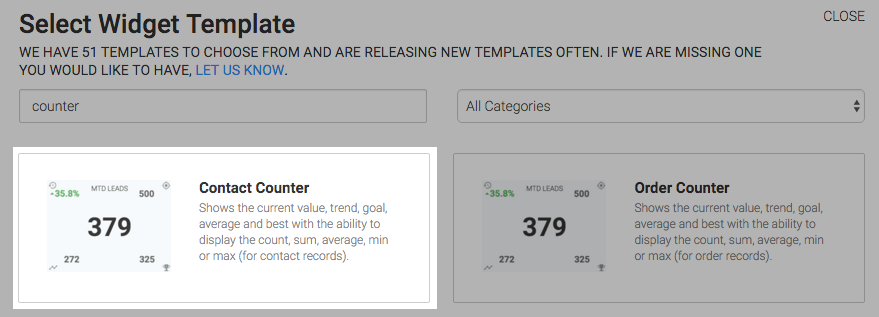
To begin, click the “+” icon on the Dashboard and type “counter” into the search bar. Then select the “Contact Counter” template.
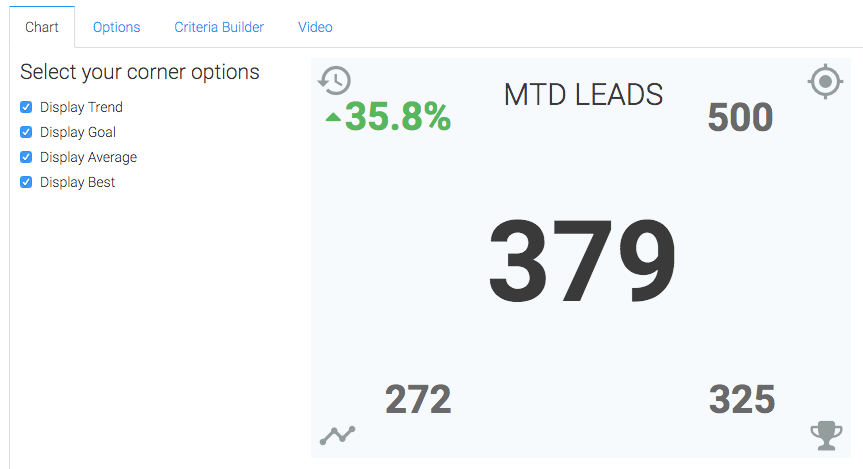
Clicking each checkbox under the chart tab will add a different value to the chart. The Trend will be displayed in the top-left, Goal is in the top-right, on the lower-left is the Average, which takes into consideration the last six cycles, and on the lower-right is Best, which takes into consideration the last twelve cycles.
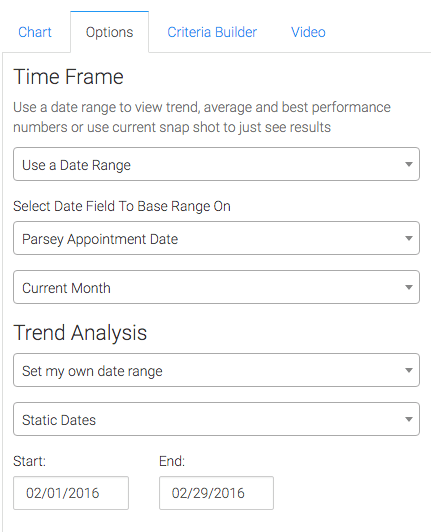
Navigate to the “Options Tab” and choose your Time Frame and Trend Analysis. If you choose the “Just see current results” option, you will lose the ability to have the Trend, Average, and Best Performance displayed.
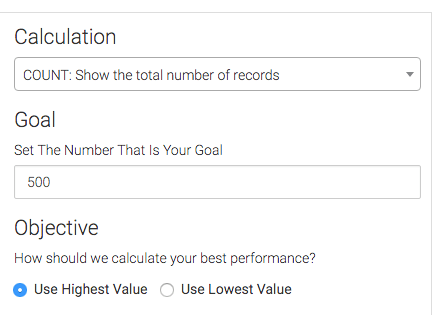
Next, choose your Calculation, Goal, and Objective options. Graphly uses the Objective setting to determine both the Best Performance as well as the Trend.
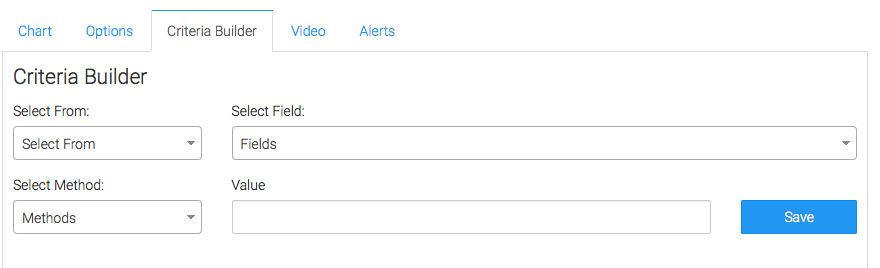
Criteria Builder
For ultimate control and customization, use the Criteria Builder to include additional rules and requirements to the report.
Once you have your everything set, click “Save Preferences” on This Widget.
Having set up your counter report, take a look at our other counter reports! If you like our reporting, let us know by leaving us a review on the Infusionsoft store!