Within Graphly there are many date ranges that affect how the data is displayed. This article is a comprehensive guide to help you understand which date range will work best for you!
Use this section to jump to sections below!
Previous
Shows data before today’s date.
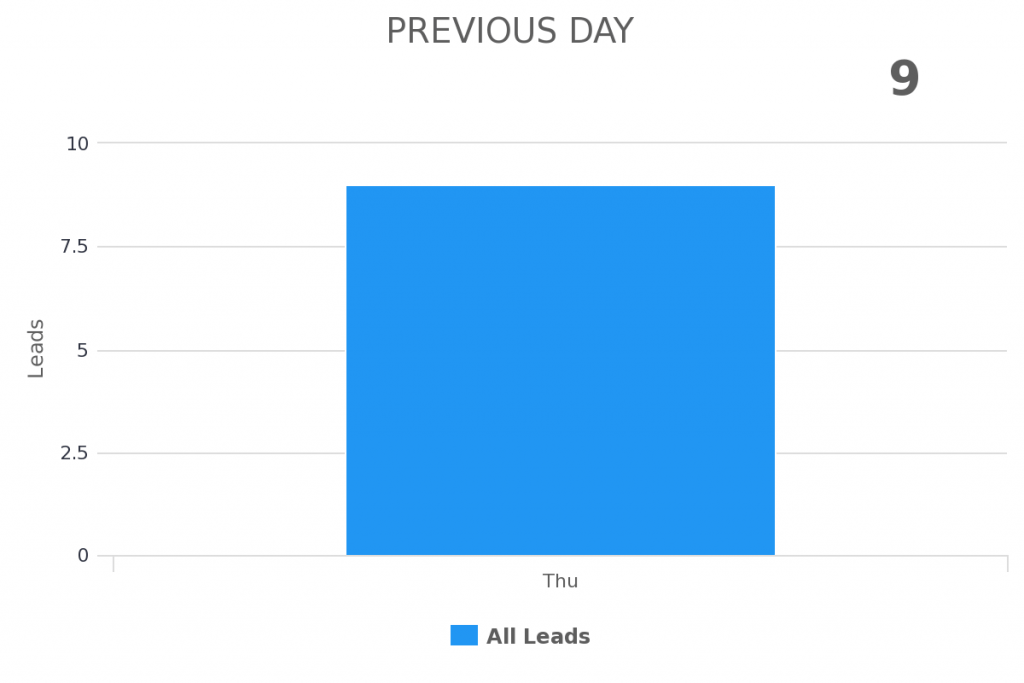
Previous Day
Shows the day before today. If today is Friday, the report will show Thursday.
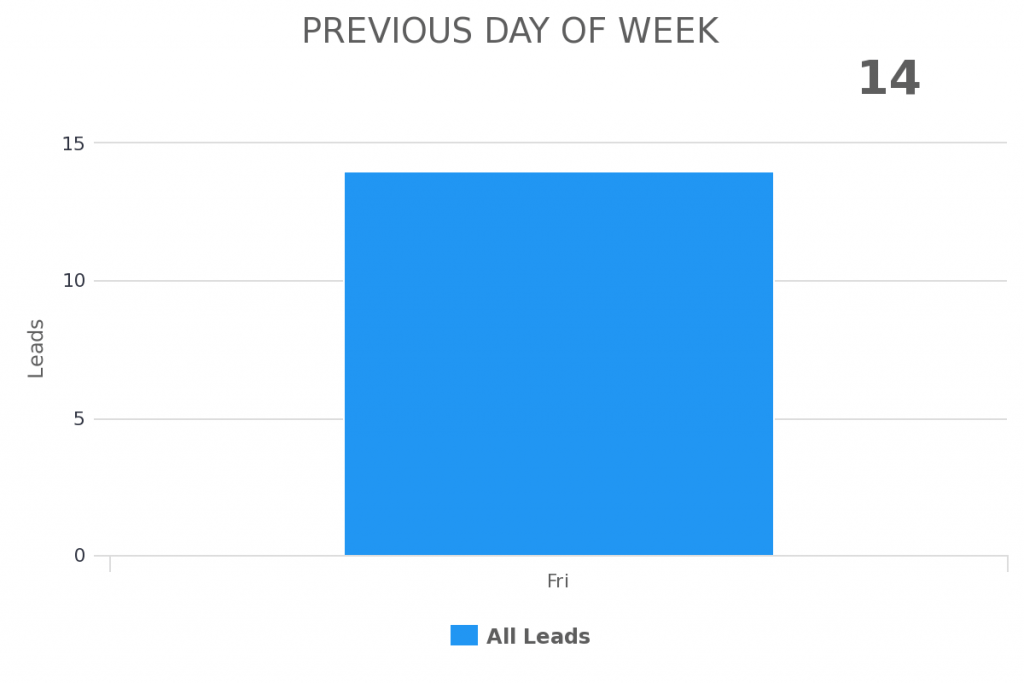
Previous Day of Week
Shows the day exactly one week before today. If today is Friday, the report will show Friday of last week.
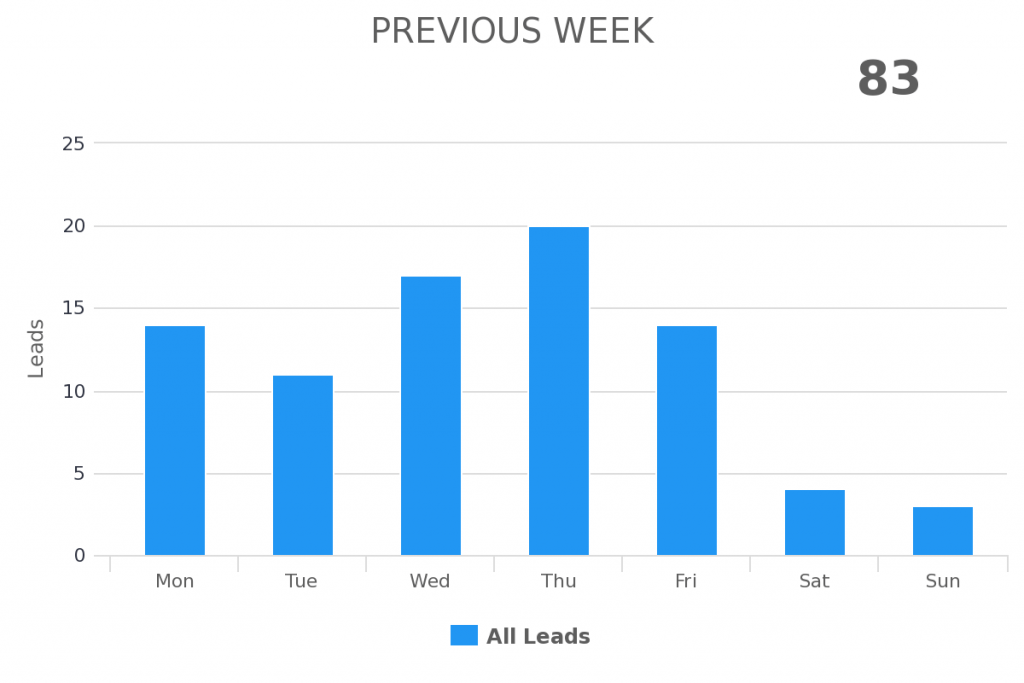
Previous Week
Shows the week prior to the current week.
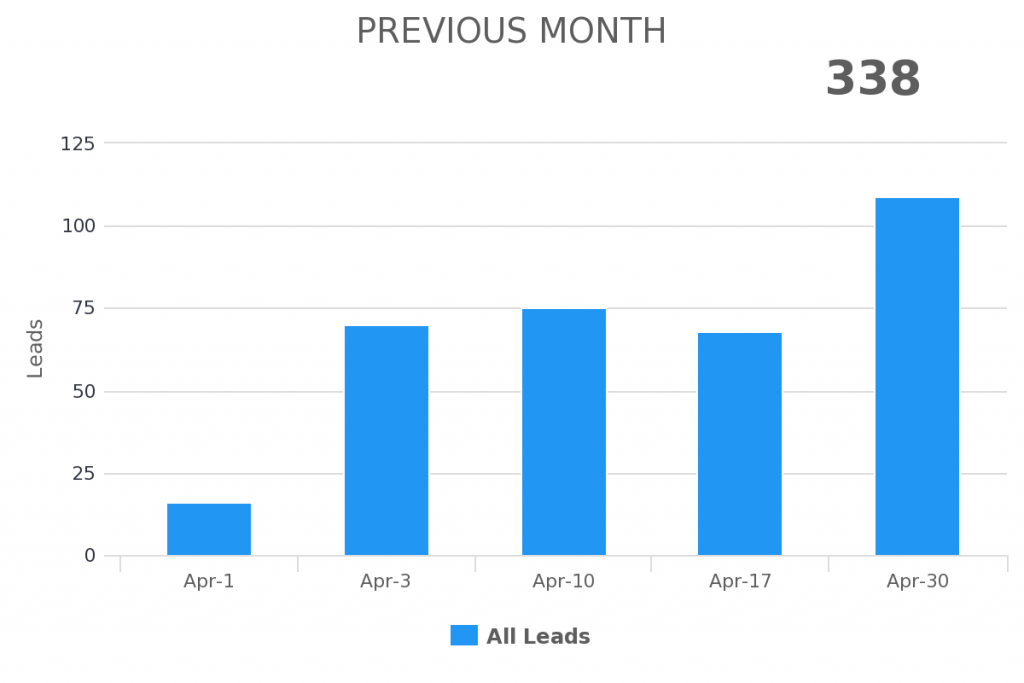
Previous Month
Shows the month prior to the current month. If this month is May, then the report would show April.
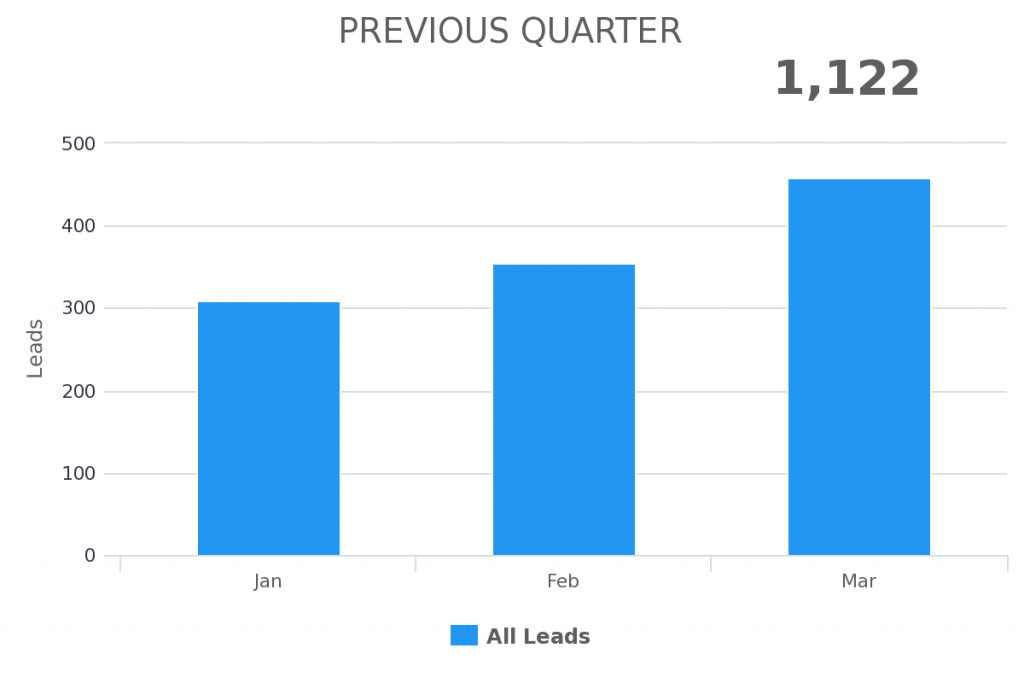
Previous Quarter
Shows the Quarter prior to the current Quarter. If this is Q2, the report will show Q1.
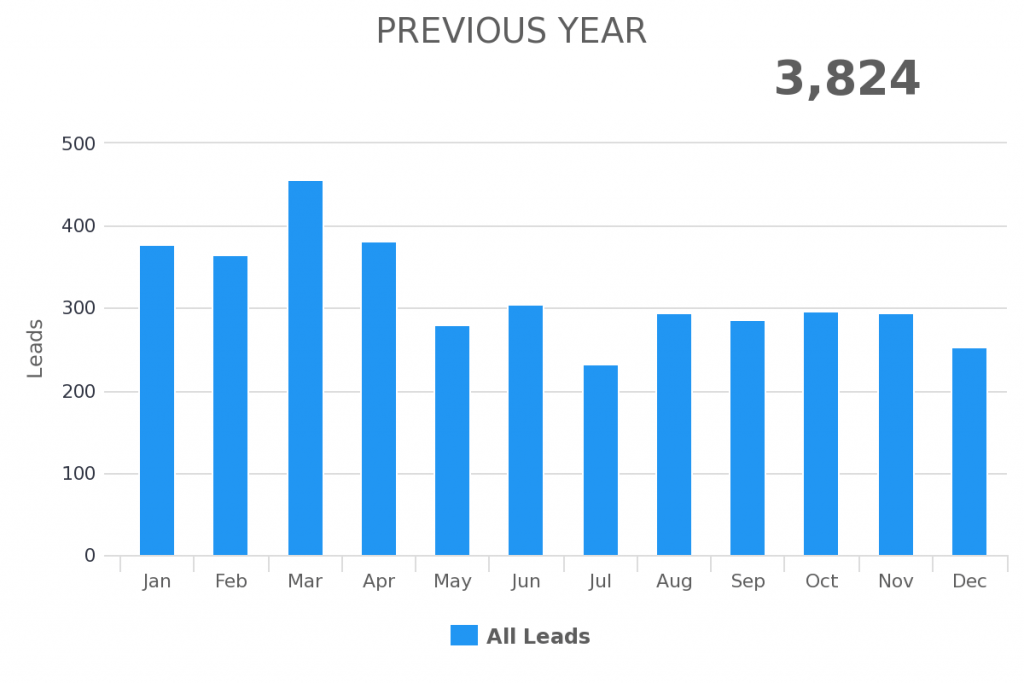
Previous Year
Shows the year prior to the current year. If this is 2017, the report will show 2016.
Current
This displays the current metric that you select as it relates to the rest of that metric.
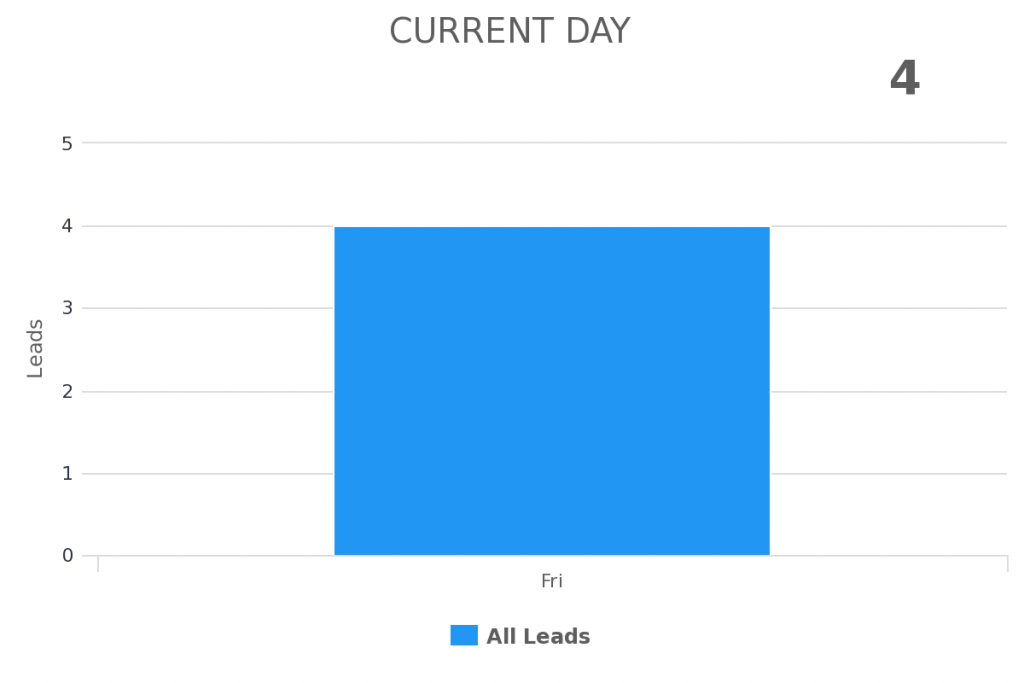
Current Day
Shows all data from today.
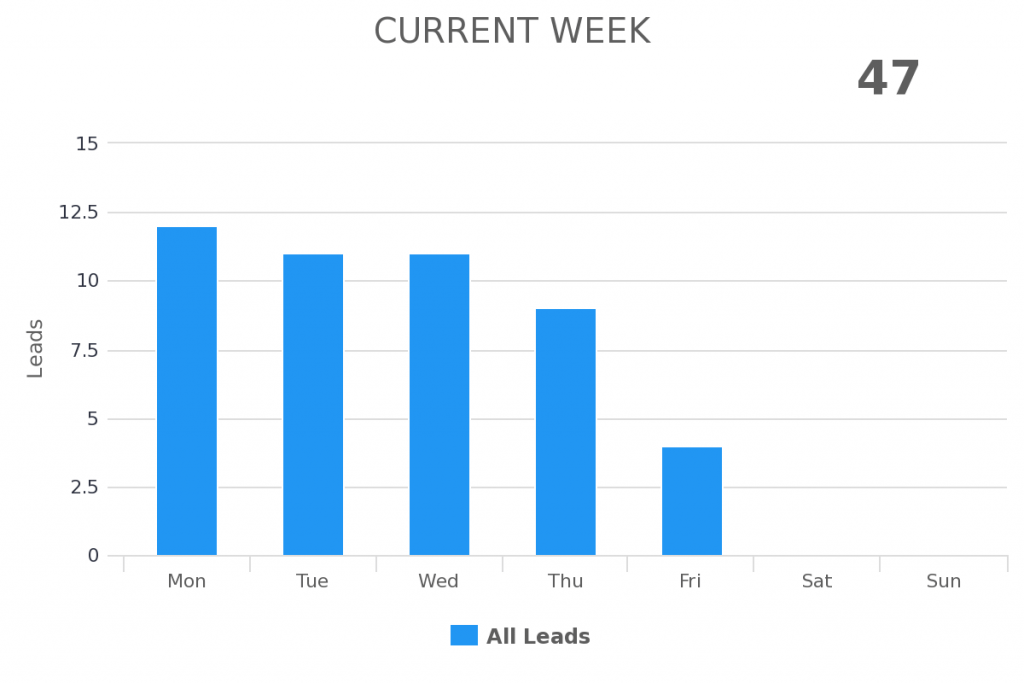
Current Week
Shows data up to the current day as it relates to the rest of the week.
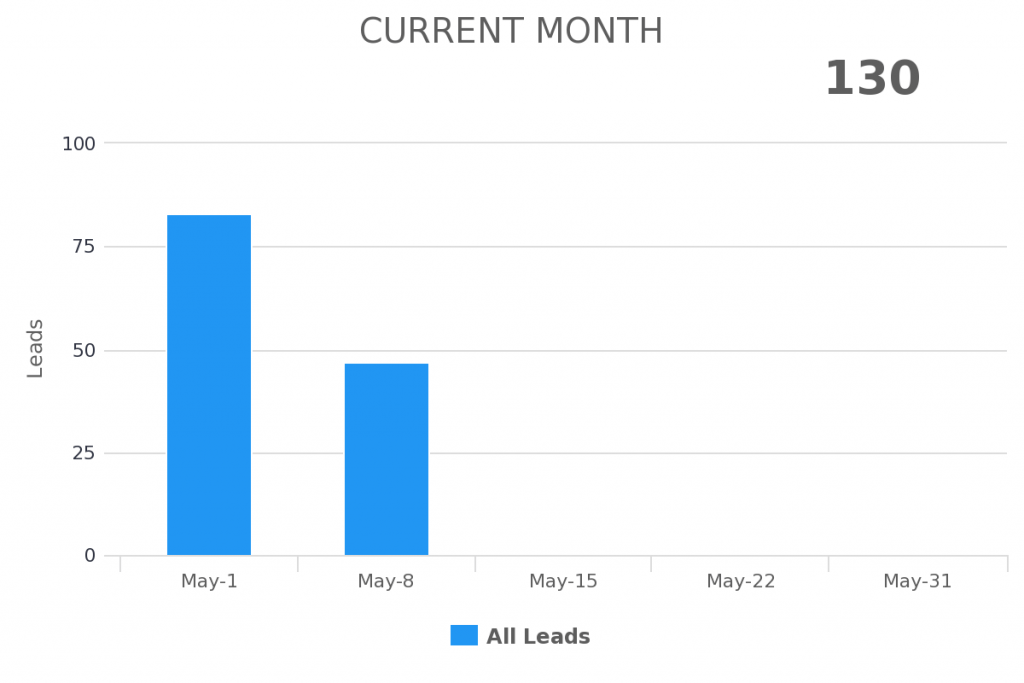
Current Month
Shows data up to the current date as it relates to the rest of the month.
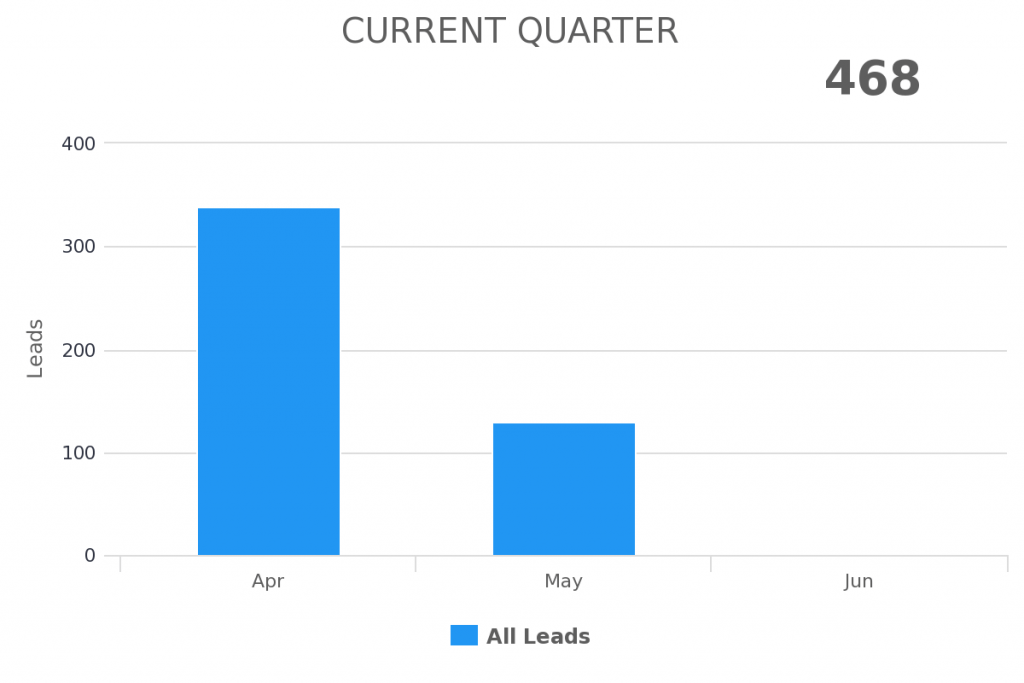
Current Quarter
Shows data up to the current date as it relates to the rest of the quarter.
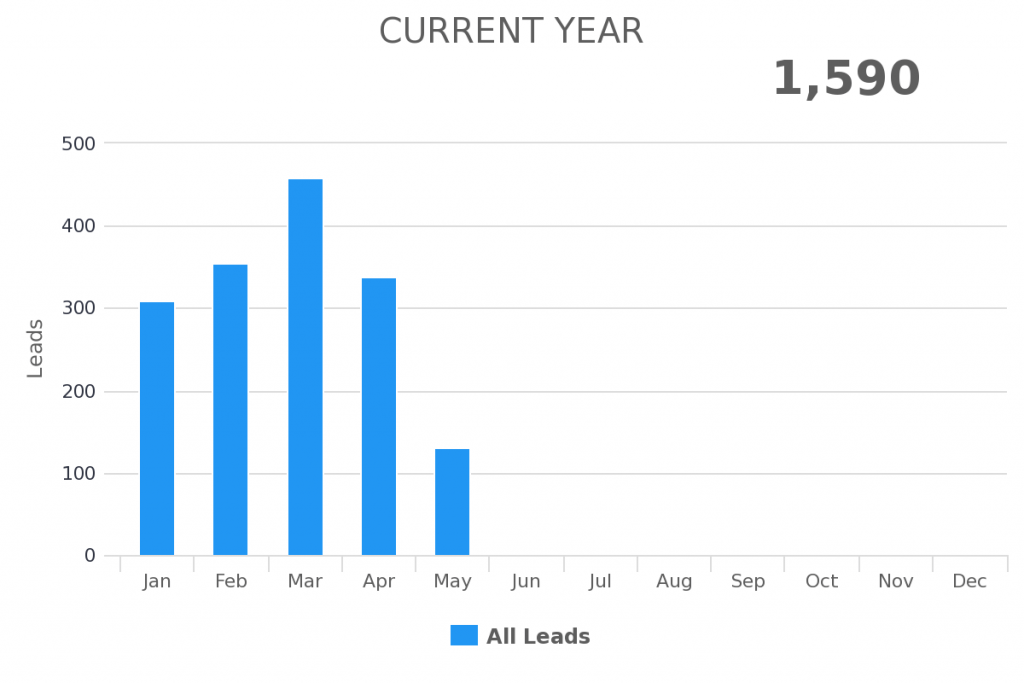
Current Year
Shows data up to the current date as it relates to the rest of the year.
To Date
Shows the current metric up to the current date.
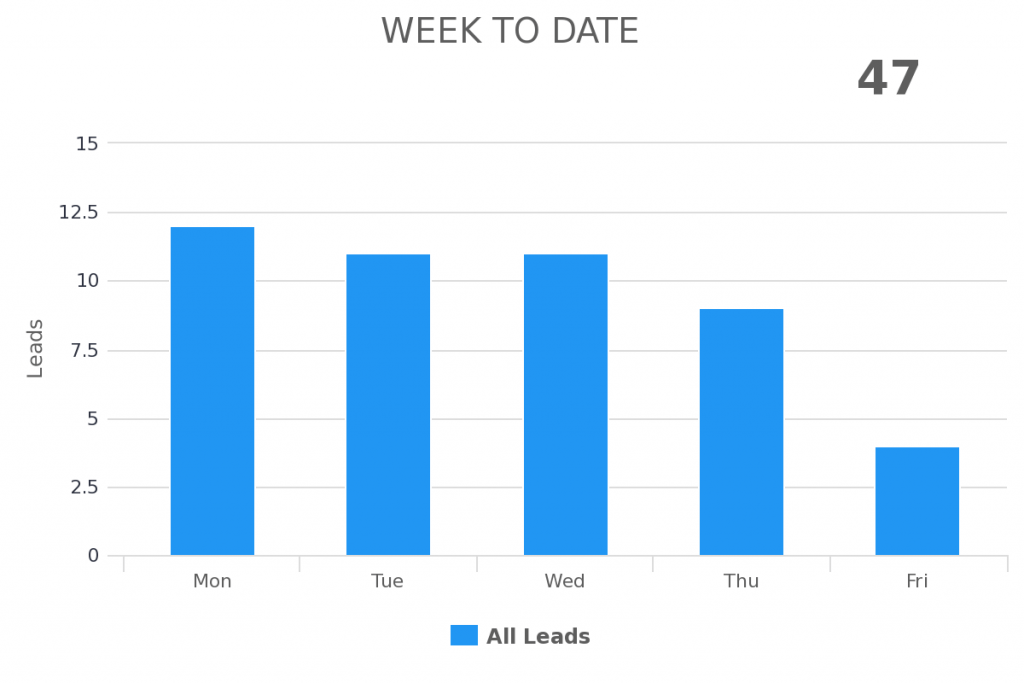
Week to Date
Shows data from the beginning of the week to today’s date.
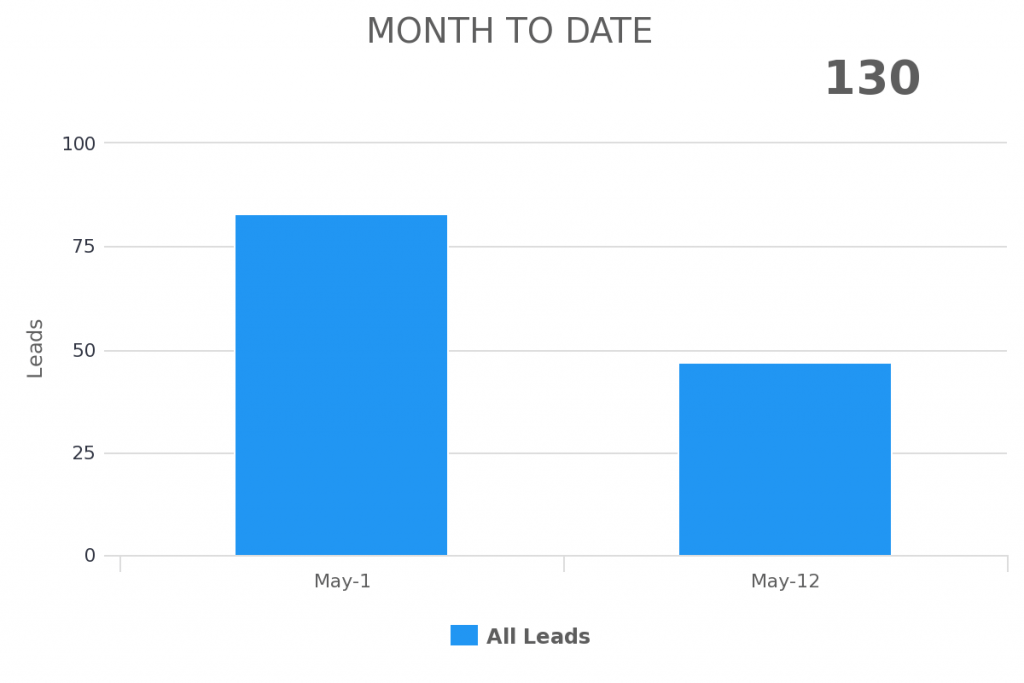
Month to Date
Shows data from the beginning of the month to today’s date.
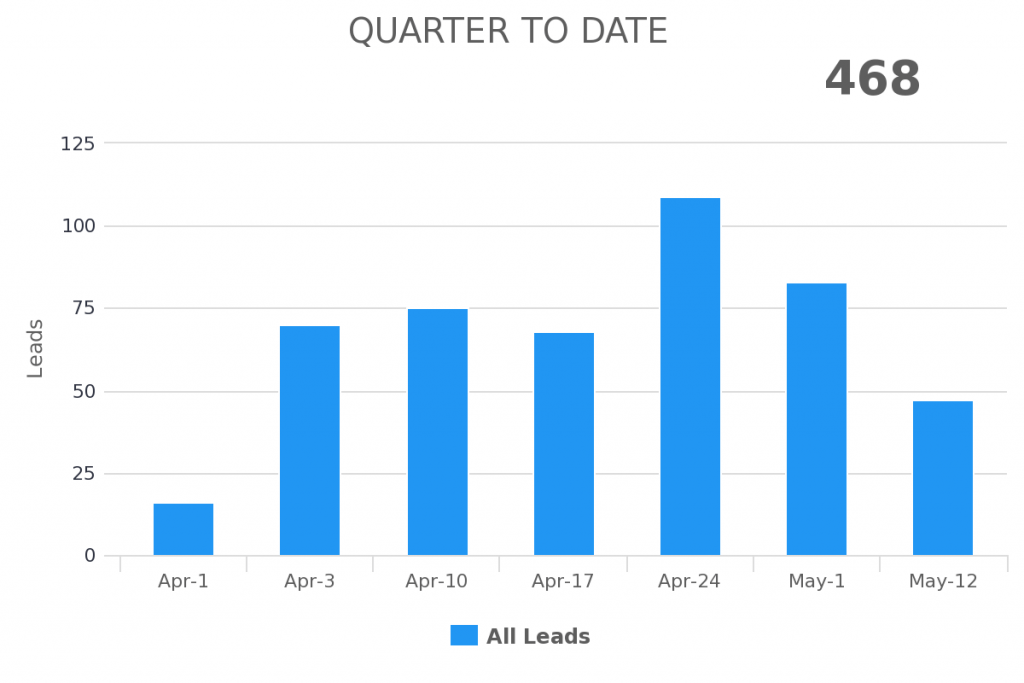
Quarter to Date
Shows data from the beginning of the quarter to today’s date.
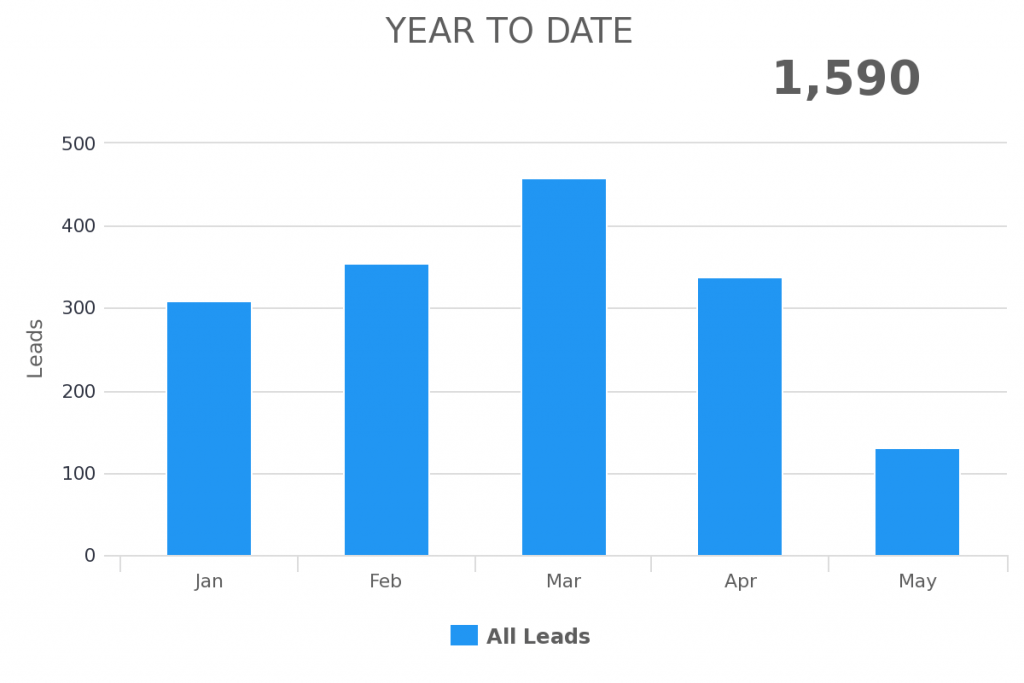
Year to Date
Shows data from beginning of the year to today’s date.
Rolling
Set amount of days/weeks/months that moves with you as you progress through time.
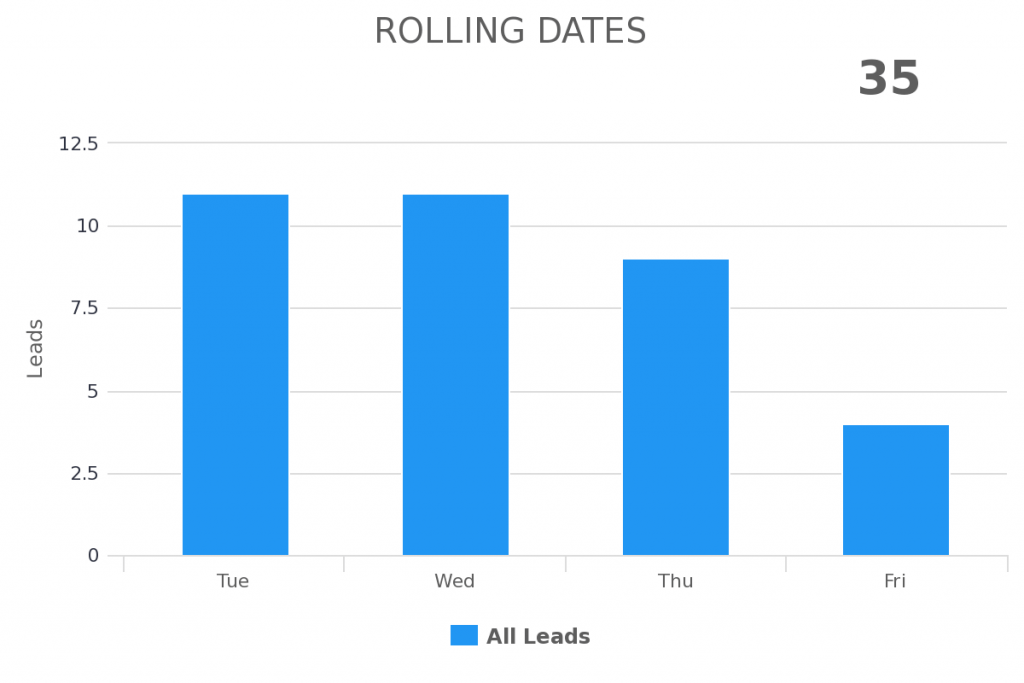
Rolling Dates
Shows data from a fixed amount back in time to today’s date. If today is Friday and the report is set for a Rolling 4 days, the report will show Tuesday, Wednesday, Thursday, Friday. Tomorrow it will show Wednesday, Thursday, Friday, Saturday.
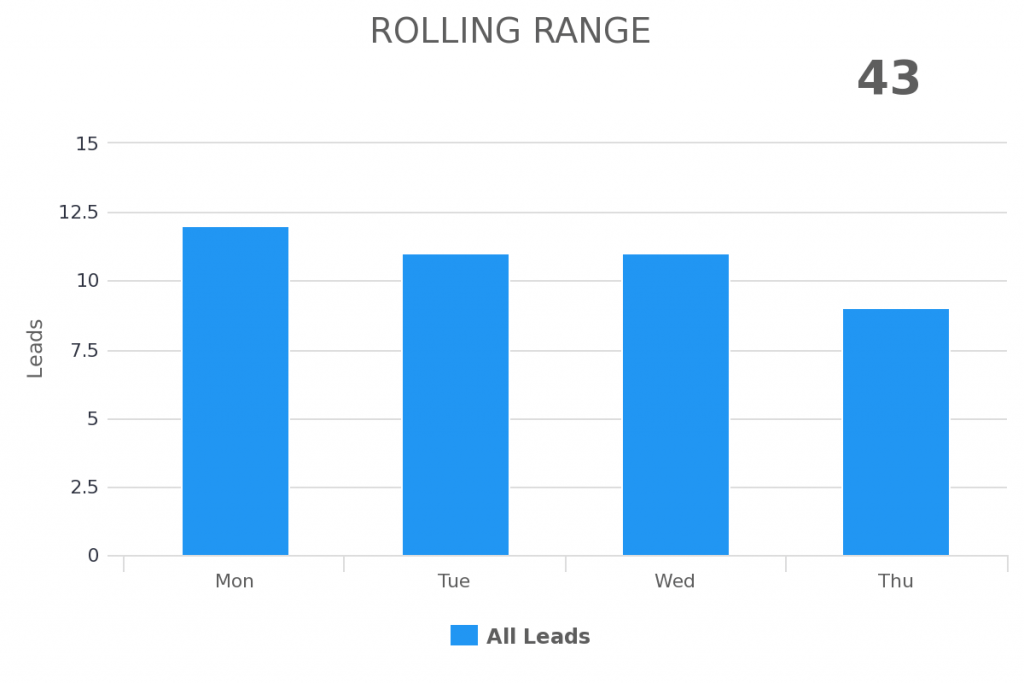
Rolling Range
Shows data from a fixed amount of days/weeks/months back in time that progresses with you through time. If today is Friday and the report is set for a Rolling Dates between 4 and 1 day ago, the report will show Monday, Tuesday, Wednesday, Thursday. Tomorrow it will show Tuesday, Wednesday, Thursday, Friday.
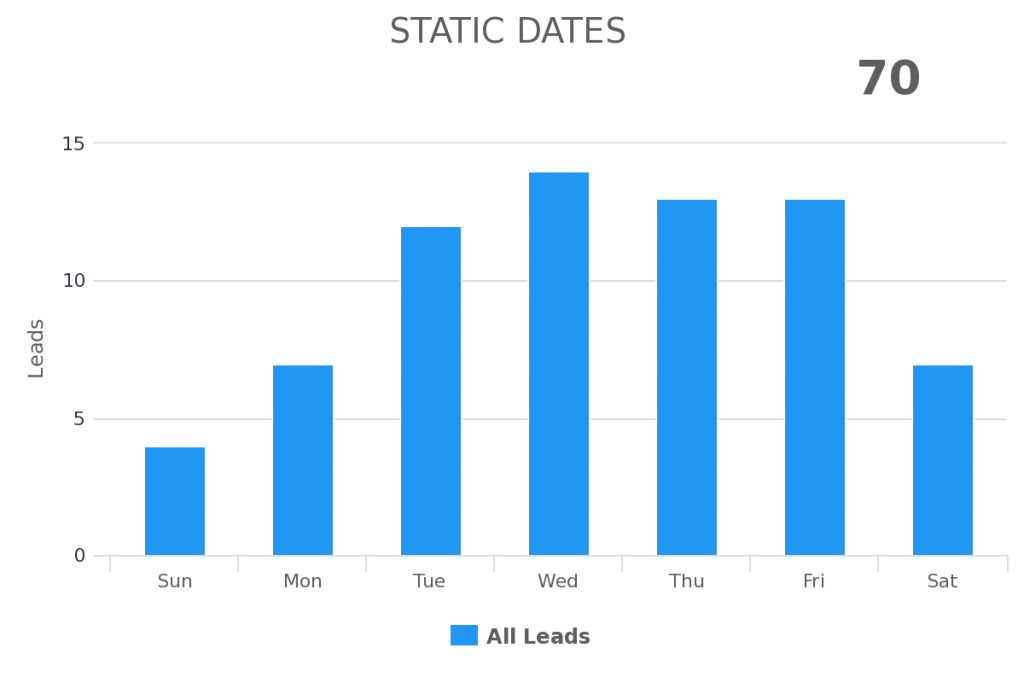
Static Dates
Shows the exact date range that you specify. The report below is showing January 1st, 2017 to January 7th, 2017.
Relevant Articles
- User Roles
- How to Add the Graphly Browser Extension
- How to view Graphly inside your Infusionsoft account
If you don’t already have a Graphly account, you can sign up for free here to get powerful Infusionsoft reporting.