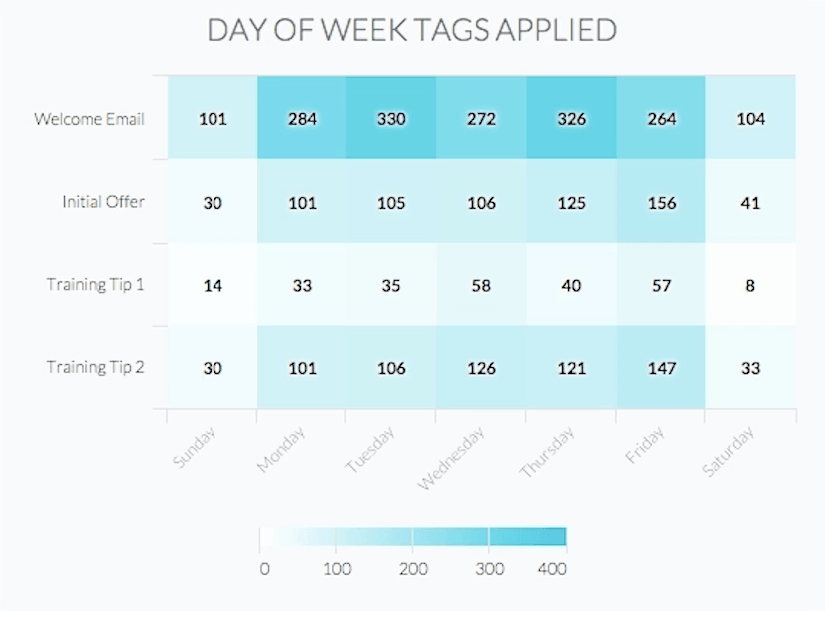
This template shows the days of the week that a particular tag, or a group of tags are applied. Or in other words, this template displays the tag activity by days.
Setting Up the Daily Tag Activity Report
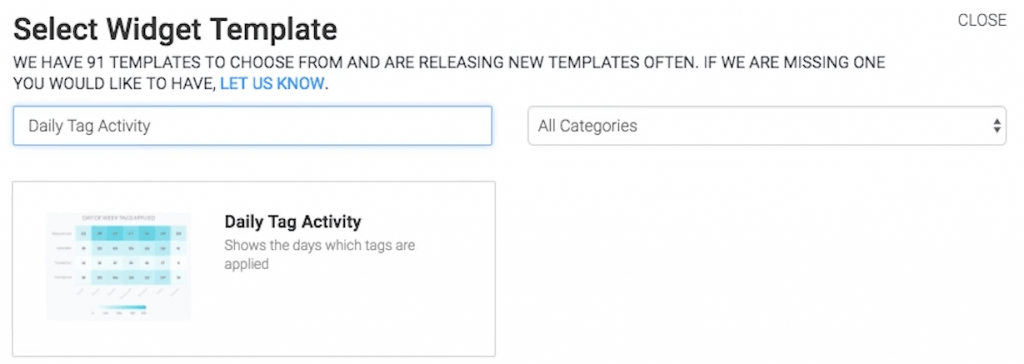
To begin, click the “+” icon on the Dashboard and type “Daily Tag Activity” into the search bar. Then select the “Daily Tag Activity” template.
v
A darker section of the heat map shows more tags being applied, and a lighter section of the heat map shows less tags being applied.
Now navigate to the options tab to add which tags to track.
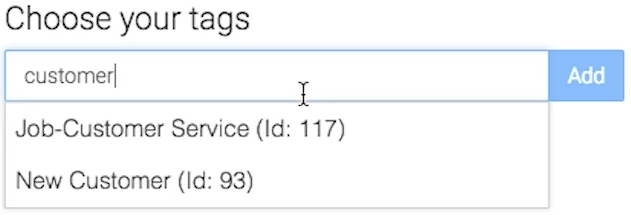
Next, decide whether you want to group your results together or see a unique row of data for each tag. To compare tags instead of combining them, make sure to select the “Separate Tags Total” Checkbox.
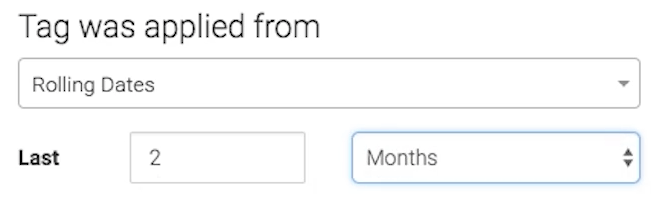
Next, select the date range you wish to measure.
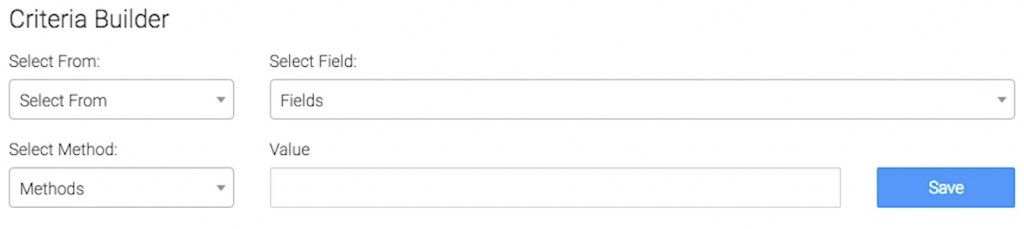
For ultimate control and customization, use the “Criteria Builder” to include additional rules and requirements for the report. Using this, you can filter results by any field on the contact record.
When finished, press the blue button at the bottom to save your preferences for this widget.

Relevent Articles
Create Your Free Graphly Dashboard
You don’t need to struggle to find the data you need from your Infusionsoft or Keap application. Create a free visual dashboard using the Graphly Lite plan. Using Graphly Lite, you get 1 user, 2 dashboards, and access to our 10 most widely used report templates. These templates include:
- Tags Applied
- Tags Applied Goal
- Leads
- Gross Revenue
- Appt | Note | Task Summary
- Email List Health
- Refunds
- Campaign Email Stats
- Text Widget Area
If you don’t already have a Graphly account, click here to get a Graphly Lite account so you can start making more informed decisions and grow your business.